
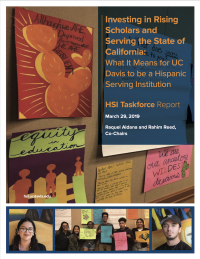
Investing in Rising Scholars and Serving the State of California
What It Means for UC Davis to be a Hispanic Serving Institution
Download the 2019 HSI Task Force Report
Letter to the UC Davis Community
The values, vision, recommendations and list of best practices gathered in this document reflect a multitude of voices who engaged with the Hispanic Serving Institution Taskforce. Adopting an identity as a R1 Hispanic Serving Institution aligns with and enhances our mission as a University of California campus and land grant institution.
We attempted to integrate the voices of students, faculty, staff, alumni, community leaders and public officials. We hope the report reflects the urgency and wisdom in the words of “Rising Scholars”; honors the years of dedication to UC Davis and to diversity and equity on the part of many faculty and staff; and responds to those who hold us accountable to our moral responsibility to serve the residents of California. This report may challenge long held beliefs and ask for change that brings uneasiness to the UC Davis community. We welcome continued dialogue necessary to move forward.
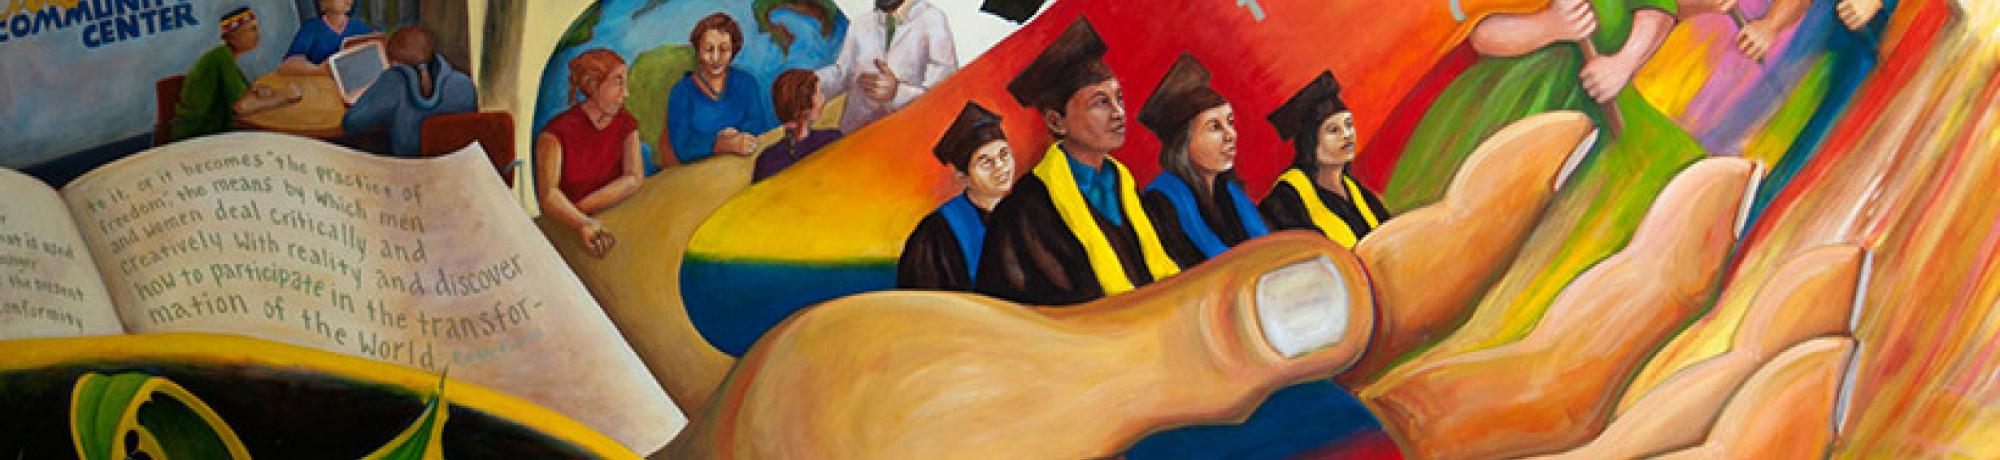
There is a saying in Spanish, “No se puede tapar el sol con un dedo” (The sun cannot be covered with one finger). The recommendations in this report embark on an equity project and call for transformative changes and bold action. Yet, visionary–even inspirational–recommendations lose meaning if there is no chance of implementation. Viability, sustainability, change readiness, process legitimacy, substantive validity, resources, accountability—these were words that we heard repeatedly. We respect that the workings of the university are complex and interrelated. Any change must be carefully deliberated by the community as a whole.
Many of the recommendations are not new and align with priorities previously identified by existing campus units. The Taskforce is also aware that some of the recommendations may call for more research or deeper thinking that takes into account other valuable considerations (such as resources, data, duplication) we may have missed.
We ask that you read these recommendations with an open heart and mind and that you not dismiss the important lessons, values and vision this document attempts to capture. Instead, we ask you reach out in good faith to help edify
our understanding, promote deeper thinking, challenge assumptions and propose other approaches we may not have included. We thank you for reading about, embracing and participating in this exciting enterprise. We are convinced that when enough of us join in, we will be on a good path to elevating the future generation of young leaders prepared and inspired to solve society’s most intractable challenges.
– UC Davis HSI Taskforce